In the previous month we had blogged on the fallacy of using a simple arithmetic sum as a method to calculate the total cost of a term life policy. We discussed the importance of discounting future cash flows in estimating cost of term life policies. Another important factor while choosing an insurer is to understand the rejection/repudiation rates of the insurer. We have perused through the annual reports of IRDAI (Insurance Regulatory and Development Authority of India) and have observed some interesting facts about rejection/repudiation rates by insurance companies in India, which we think are relevant for the prospective life insurance buyer.
Rejection or repudiation?
My insurance club, states that claim repudiation applies to a claim that has been processed and is found unpayable. When a customer makes a claim on the grounds or conditions which are not covered under the policy conditions, the insurer repudiates the claim. The conditions or the loss are not covered under the policy. This is called claim repudiation. In such a case, insurers aren’t liable to pay.
Rejection on the other hand occurs before the claim has been processed. This is mainly because of non-disclosure or wrong disclosure of information by customers such as the nature of the occupation, pre-existing diseases or age, etc. Other reasons for rejections include – lapsed policy and standard policy exclusions or delay in document submission.
In FY20-21, the insurance industry there was a total of Rs 28,227/- cr worth claims, repudiated claims were about Rs 864/- cr worth and rejected claims were about Rs 60cr. Clearly repudiation of claims is a larger risk factor - and we will focus our analysis on the same.
Repudiation rate trends:
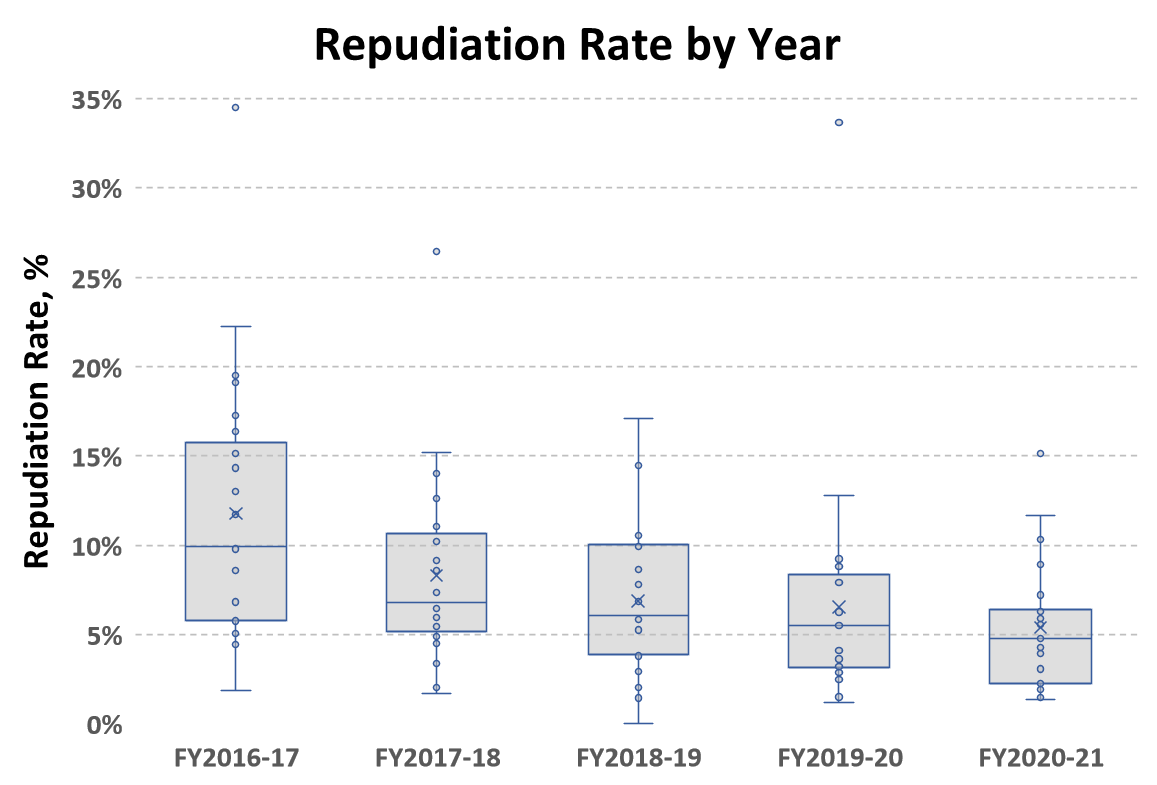
A plot of the repudiation rates over time is provided below :

Graph-1
Conclusions from Graph-1:
Graph-1 indicates that there is a huge spread in the repudiation rates across companies. This is alarming because potential buyers of insurance clearly cannot expect similar levels of repudiation across insurers and hence buyers must be very careful before selecting their life insurer. Life insurance is a product where one needs high certainty that a claim will be accepted in case of death of the insured. If the claim is rejected / repudiated by the insurer, it can be catastrophic for the beneficiaries/nominees of the life insurance policy. It thus will be prudent to choose life insurers who have below average repudiation rates.
Graph-1 also indicates that there is a general trend of insurers improving (reducing) their repudiation rates over the years. Though this is heartening to note, even in the latest FY20-21 data the lowest repudiation rate was 1.45% and the highest repudiation rate was 15.14%. Clearly this is a spread too large to ignore.
Repudiation rates by insurer:
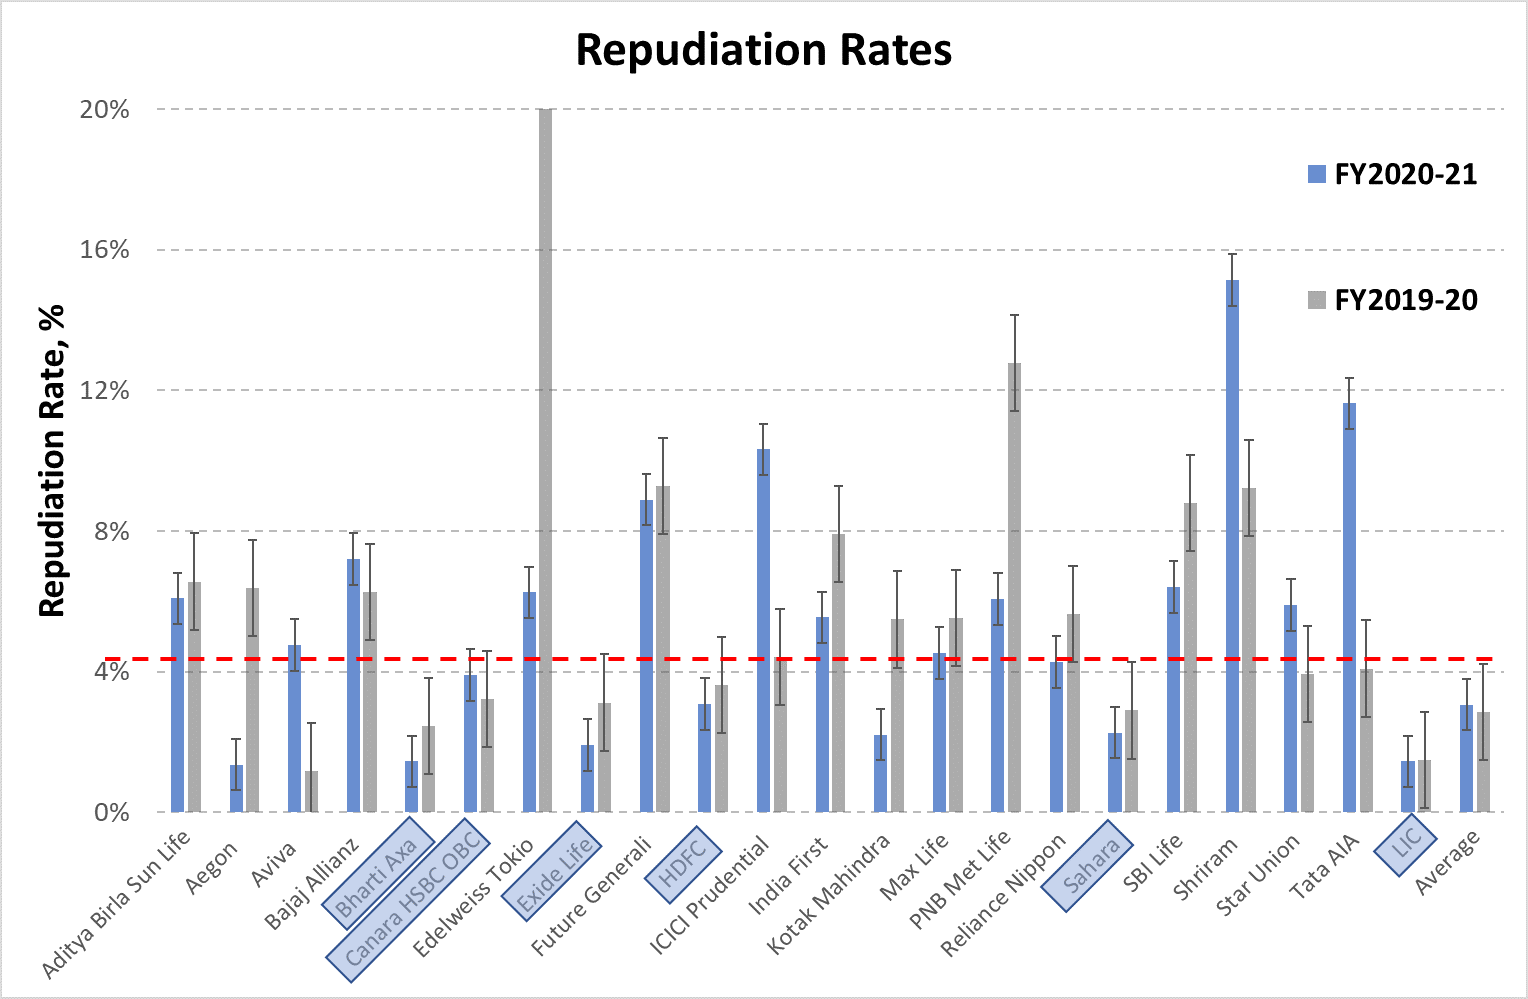
The graph below presents the repudiation rates by insurer for FY19-20 and FY20-21.:

Graph-2
Graph-2 shows which insurers over the past two years have had below average repudiation rates. While it may be true that repudiation by insurers happens due to genuine reasons, when an insurer has a significantly above average repudiation rate the prospective insurance buyer must proceed with caution. We have provided two years data above. Insurers with below average repudiation rates (dashed red line) have been boxed in light blue for the reader's benefit.
Average Claim Size vs Repudiated Claim Size:

Graph-3
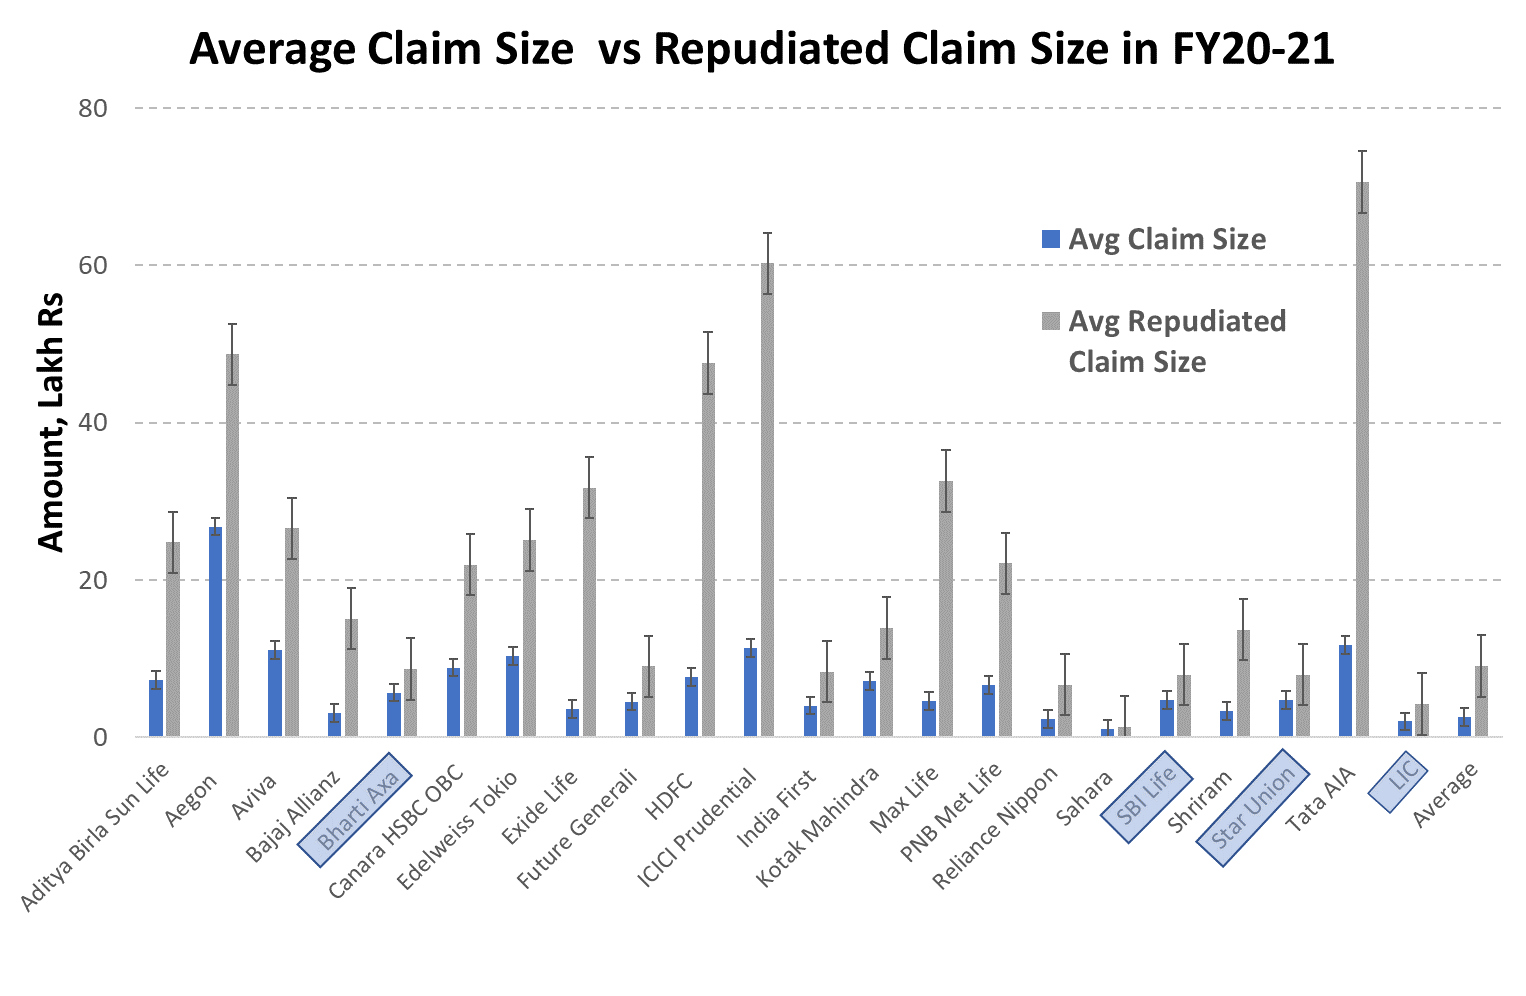
IRDAI in its annual reports presents repudiation rates both by number and by amount. This allows us to calculate the average claim size versus the average repudiated claim size. One would assume there is no reason for the average claim size to be any different from the average repudiated claim size. The reason for a claim being repudiated should ideally be independent of the size of the claim (in rupees). However the data interestingly shows that most insurers have a statistically significant difference in amount between the average claim and the average repudiated claim. The average repudiated claim being significantly higher. It may be true that higher claim policies tend to have more reasons for repudiation, nevertheless with such stark differences between the average claim size and average repudiated claim size it would be advisable for the prospective buyer of life insurance to tread with caution. A practical implication is that it is preferable the policy sum assured amount be comparable to the normal policy sum assured size of the insurer - so that the the risk of repudiation is reduced. This is pretty inconvenient for prospective buyers who need to insure themselves for large amounts. It thus would require them to spread their sum assured across multiple insurers and further reduce the risk. In Graph-3 above we have highlighted in light blue boxes, insurers who do not have a statistical difference in amount between the average claim and the average repudiated claim. We would prefer these insurers especially when large claims are involved.
Summary:
1. Choose insurers who have a below average repudiation rate (by amount).
2. Prefer insurers who have less or no statistical difference between the average claim size and average repudiated claim size
3. Buy policies with sum assured not too much higher than the average policy claim size of the insurer.
4. Spread your life insurance cover needs across multiple insurers
Rejection or repudiation?
My insurance club, states that claim repudiation applies to a claim that has been processed and is found unpayable. When a customer makes a claim on the grounds or conditions which are not covered under the policy conditions, the insurer repudiates the claim. The conditions or the loss are not covered under the policy. This is called claim repudiation. In such a case, insurers aren’t liable to pay.
Rejection on the other hand occurs before the claim has been processed. This is mainly because of non-disclosure or wrong disclosure of information by customers such as the nature of the occupation, pre-existing diseases or age, etc. Other reasons for rejections include – lapsed policy and standard policy exclusions or delay in document submission.
In FY20-21, the insurance industry there was a total of Rs 28,227/- cr worth claims, repudiated claims were about Rs 864/- cr worth and rejected claims were about Rs 60cr. Clearly repudiation of claims is a larger risk factor - and we will focus our analysis on the same.
Repudiation rate trends:
A plot of the repudiation rates over time is provided below :

Graph-1
Conclusions from Graph-1:
Graph-1 indicates that there is a huge spread in the repudiation rates across companies. This is alarming because potential buyers of insurance clearly cannot expect similar levels of repudiation across insurers and hence buyers must be very careful before selecting their life insurer. Life insurance is a product where one needs high certainty that a claim will be accepted in case of death of the insured. If the claim is rejected / repudiated by the insurer, it can be catastrophic for the beneficiaries/nominees of the life insurance policy. It thus will be prudent to choose life insurers who have below average repudiation rates.
Graph-1 also indicates that there is a general trend of insurers improving (reducing) their repudiation rates over the years. Though this is heartening to note, even in the latest FY20-21 data the lowest repudiation rate was 1.45% and the highest repudiation rate was 15.14%. Clearly this is a spread too large to ignore.
Repudiation rates by insurer:
The graph below presents the repudiation rates by insurer for FY19-20 and FY20-21.:

Graph-2
Graph-2 shows which insurers over the past two years have had below average repudiation rates. While it may be true that repudiation by insurers happens due to genuine reasons, when an insurer has a significantly above average repudiation rate the prospective insurance buyer must proceed with caution. We have provided two years data above. Insurers with below average repudiation rates (dashed red line) have been boxed in light blue for the reader's benefit.
Average Claim Size vs Repudiated Claim Size:

Graph-3
IRDAI in its annual reports presents repudiation rates both by number and by amount. This allows us to calculate the average claim size versus the average repudiated claim size. One would assume there is no reason for the average claim size to be any different from the average repudiated claim size. The reason for a claim being repudiated should ideally be independent of the size of the claim (in rupees). However the data interestingly shows that most insurers have a statistically significant difference in amount between the average claim and the average repudiated claim. The average repudiated claim being significantly higher. It may be true that higher claim policies tend to have more reasons for repudiation, nevertheless with such stark differences between the average claim size and average repudiated claim size it would be advisable for the prospective buyer of life insurance to tread with caution. A practical implication is that it is preferable the policy sum assured amount be comparable to the normal policy sum assured size of the insurer - so that the the risk of repudiation is reduced. This is pretty inconvenient for prospective buyers who need to insure themselves for large amounts. It thus would require them to spread their sum assured across multiple insurers and further reduce the risk. In Graph-3 above we have highlighted in light blue boxes, insurers who do not have a statistical difference in amount between the average claim and the average repudiated claim. We would prefer these insurers especially when large claims are involved.
Summary:
1. Choose insurers who have a below average repudiation rate (by amount).
2. Prefer insurers who have less or no statistical difference between the average claim size and average repudiated claim size
3. Buy policies with sum assured not too much higher than the average policy claim size of the insurer.
4. Spread your life insurance cover needs across multiple insurers
