Mr. Harsh Roongta, in his inciteful blog Evaluate funds on rolling returns over long term, makes the case for being extremely careful before being taken in by “magic bullet” ideas that solve all problems and generate the highest returns. Buttressing his points with the metaphor of getting to Worli from Bandra via multiple routes, Mr. Roongta explains that while the starting point and destination are the same, the path taken is equally important. Each path to Worli from Bandra has hidden risks and it may not be a very simple decision on which path to take. In a comparison between the performance of the Nifty-50 and Nifty-200 Momentum-30 (from now on referred to as Momentum-30) indices, he shows that rolling returns over longer periods are a better indicator of fund performance versus a sales pitch showing a single year return with an outsized performance for the Momentum-30 index.
In our opinion, time is the enemy of the charlatan. Likewise, time is the friend of a diligent, process oriented and fiduciary approach to wealth management. As the time horizon of analysis is extended, the underlying risk of an investment strategy invariably manifests itself. As Mr. Roongta has shown that, while on an “average” the Momentum-30 index outperforms the Nifty-50 index, there are chances that the Nifty-50 can outperform in certain cases. The word average is a dangerous term in investment strategy. Hidden in the average are multiple outcomes some of which can be very different from the average. Here we provide a small addendum to Mr. Roongta’s brilliant analysis.
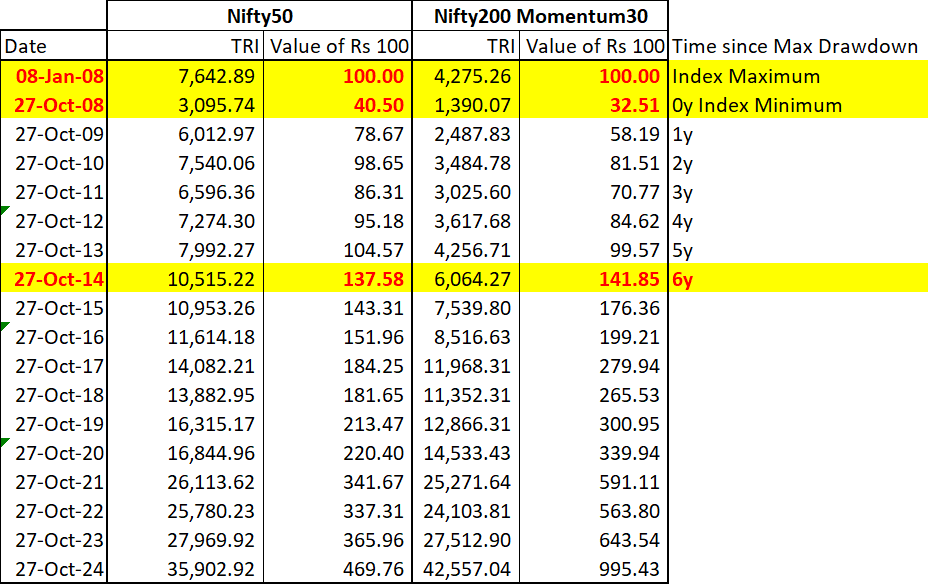
Another way of looking at risk is to understand what has been the worst-case scenario of returns in an investment strategy. In our blog Cross the River by Feeling the Stones : 31-Oct-19 we explain the concept of the Maximum Drawdown. When we apply this concept to compare the two indices, we find that the Max Drawdown since 1-Apr-2005 (date from which data is existing for the Momentum-30 index) is -59.50% for Nifty-50 vs -67.69% for Momentum-30 index. If this is correct, it would mean that the worst-case scenario for 100 Rs in Nifty-50 would have been Rs 40.50 vs Rs 32.51 for the Momentum-30 Index. This is how a Rs 100 invested on the date of the highest values of the Nifty-50 and Momentum-30 indices (08-Jan-2008) grows in both the indices:

The above table implies that under this worst-case scenario, the Momentum-30 index took a full 6 years to catch up with the Nifty-50 and recoup its relative underperformance. Clearly 6 years is not a short time frame. Many an investor is likely to feel significant emotional pain during this period.
Advisers are paid for generating returns AND avoiding risks that are not compatible with an investor’s appetite/capability for risk. The advisor and the client should assess whether the higher historical maximum drawdown in the Momentum-30 index is within the investor’s risk appetite and is justified by the extra historical outperformance in return. Ignoring the “path” to high returns is a perilous undertaking. Thank you Mr. Roongta for inspiring this investigation.
In our opinion, time is the enemy of the charlatan. Likewise, time is the friend of a diligent, process oriented and fiduciary approach to wealth management. As the time horizon of analysis is extended, the underlying risk of an investment strategy invariably manifests itself. As Mr. Roongta has shown that, while on an “average” the Momentum-30 index outperforms the Nifty-50 index, there are chances that the Nifty-50 can outperform in certain cases. The word average is a dangerous term in investment strategy. Hidden in the average are multiple outcomes some of which can be very different from the average. Here we provide a small addendum to Mr. Roongta’s brilliant analysis.
Another way of looking at risk is to understand what has been the worst-case scenario of returns in an investment strategy. In our blog Cross the River by Feeling the Stones : 31-Oct-19 we explain the concept of the Maximum Drawdown. When we apply this concept to compare the two indices, we find that the Max Drawdown since 1-Apr-2005 (date from which data is existing for the Momentum-30 index) is -59.50% for Nifty-50 vs -67.69% for Momentum-30 index. If this is correct, it would mean that the worst-case scenario for 100 Rs in Nifty-50 would have been Rs 40.50 vs Rs 32.51 for the Momentum-30 Index. This is how a Rs 100 invested on the date of the highest values of the Nifty-50 and Momentum-30 indices (08-Jan-2008) grows in both the indices:

The above table implies that under this worst-case scenario, the Momentum-30 index took a full 6 years to catch up with the Nifty-50 and recoup its relative underperformance. Clearly 6 years is not a short time frame. Many an investor is likely to feel significant emotional pain during this period.
Advisers are paid for generating returns AND avoiding risks that are not compatible with an investor’s appetite/capability for risk. The advisor and the client should assess whether the higher historical maximum drawdown in the Momentum-30 index is within the investor’s risk appetite and is justified by the extra historical outperformance in return. Ignoring the “path” to high returns is a perilous undertaking. Thank you Mr. Roongta for inspiring this investigation.
